“`html
Understanding the Impact of Index Rebalance Days on Trading Volumes
As we’ve noted before, index rebalance days tend to result in much larger closing auctions. That’s because most index funds try to exactly match what their index provider does – and index changes happen using the official closing price.
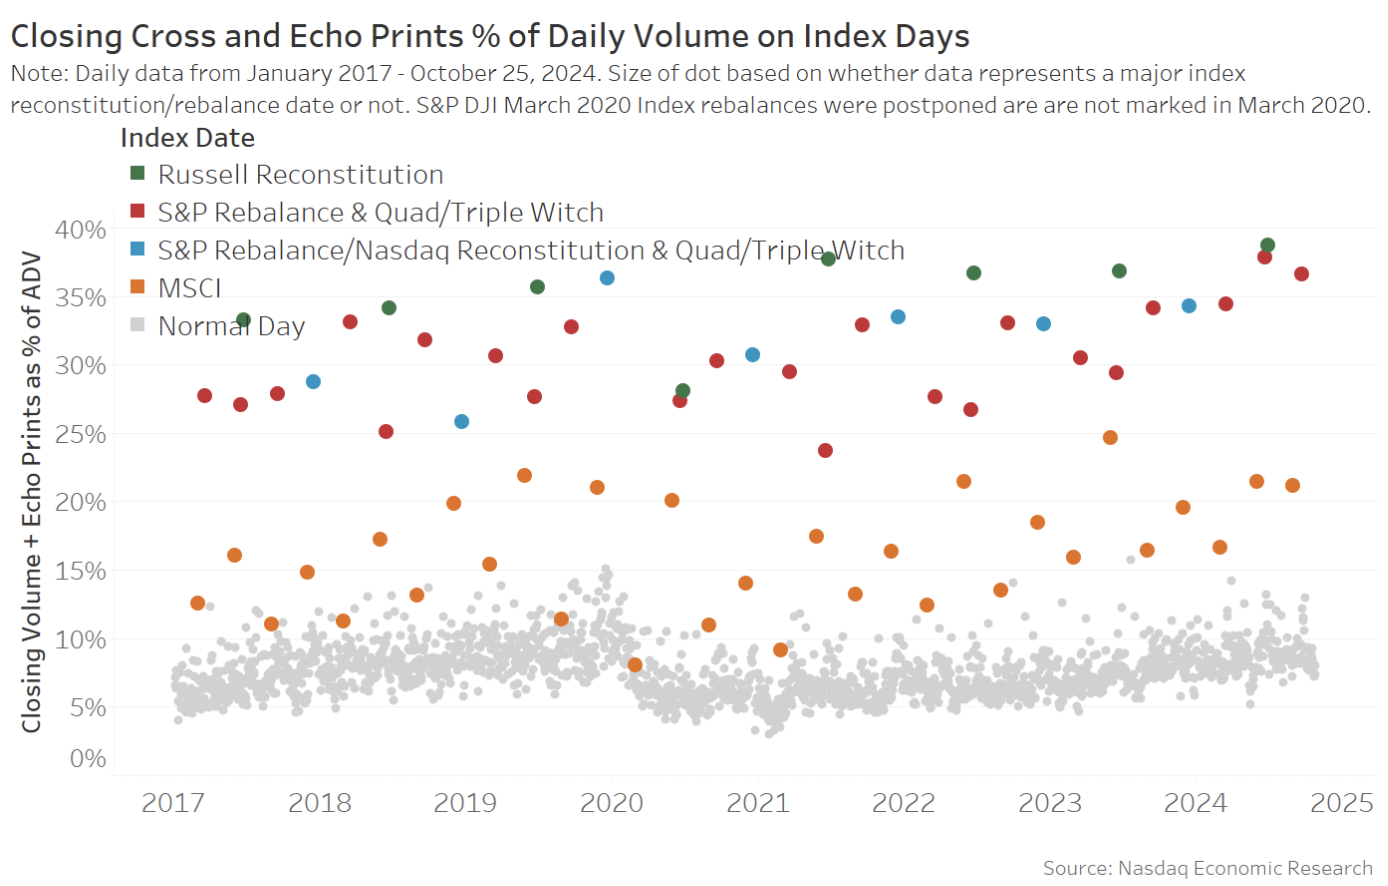
For example, a typical close accounts for less than 10% of volume traded during the day; meanwhile, some index rebalance dates see over 30% of volume traded in the close.
Based on this knowledge, we can use the size of the closing trades on index addition days to estimate total index fund tracking. The results show that many companies might have around a quarter of all float-shares bought by different index funds.
It’s important to note that companies benefit from being added to major indexes as they see significant new (and typically long-term) investors.
High Closing Volumes on Index Rebalance Days
As the data in the chart below shows, there are just a few dates each year when index trades typically happen:
- MSCI typically rebalances at the end of May and November. S&P, Nasdaq, and FTSE indexes rebalance on the third Friday of the last month in the quarter. That’s also “quad witch” day, which makes the closing volumes even higher.
- Russell rebalances their indexes once a year, usually on the last Friday in June that is not quarter end.
Chart 1: Index rebalance days see exceptionally large closing volumes
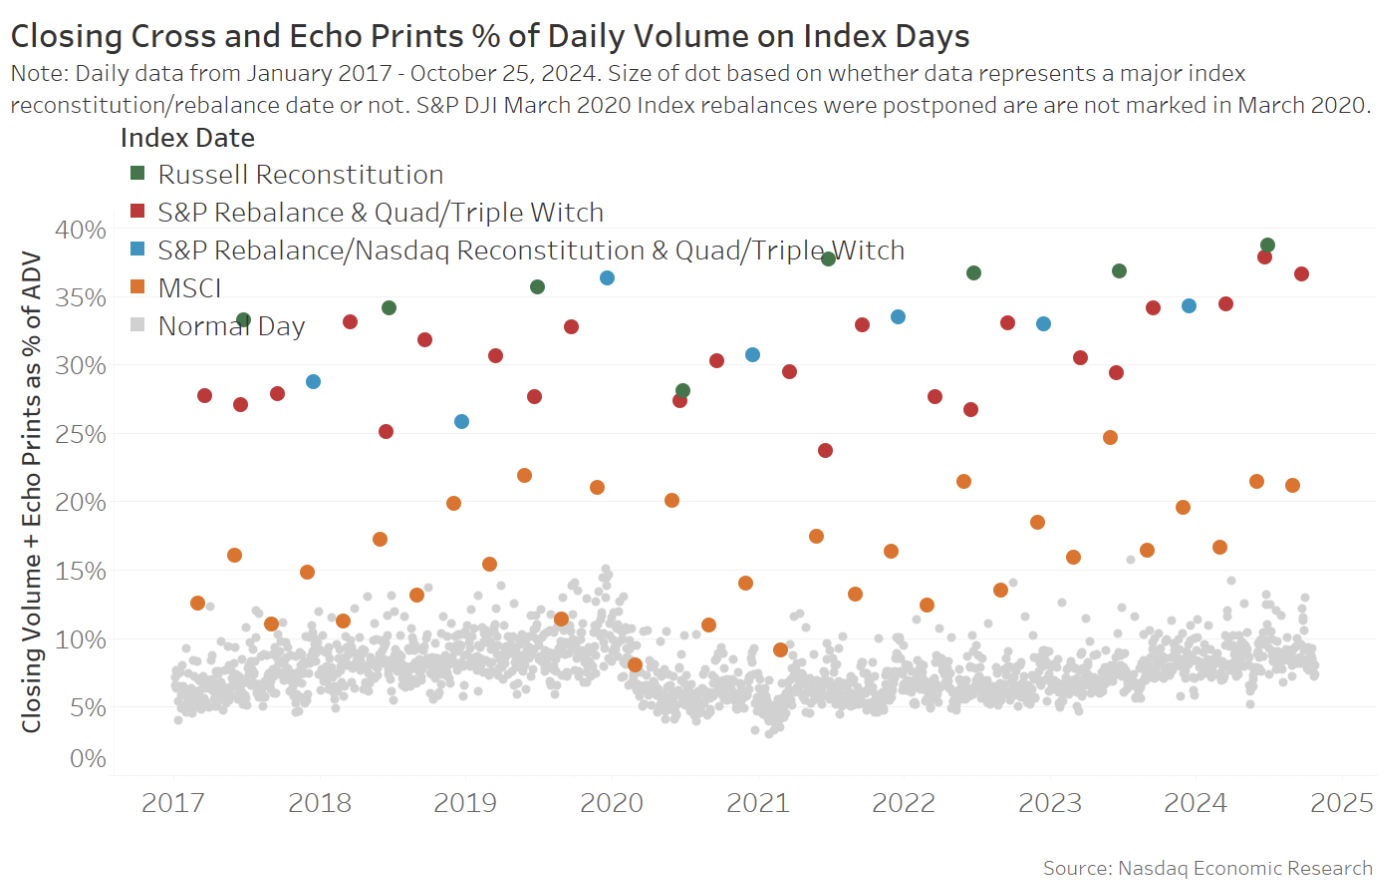
A typical close currently adds to around $40 billion in trading, which is less than 10% of the volume traded during the day (grey dots).
In contrast, S&P and Russell index dates see an average of $240 billion trading in the close, which adds over 30% of the day’s volume (ADV). Even MSCI rebalances cause the close to increase to around 20% of ADV.
Estimating Index Fund Tracking Through Closing Trading
There are two ways to estimate how much index fund tracking adds to each index:
- Top down: Sometimes index providers disclose how much money tracks their indexes. Some academics have also tallied up all the index fund holdings from 13F filings. You could even reconcile that to ICI disclosures that now state index funds are around 50% of all mutual funds.
- Bottoms up: This approach looks at the actual shares traded on index rebalance dates. Since index funds primarily trade on those days to align with the index changes, these volumes can reveal the scale of index fund ownership.
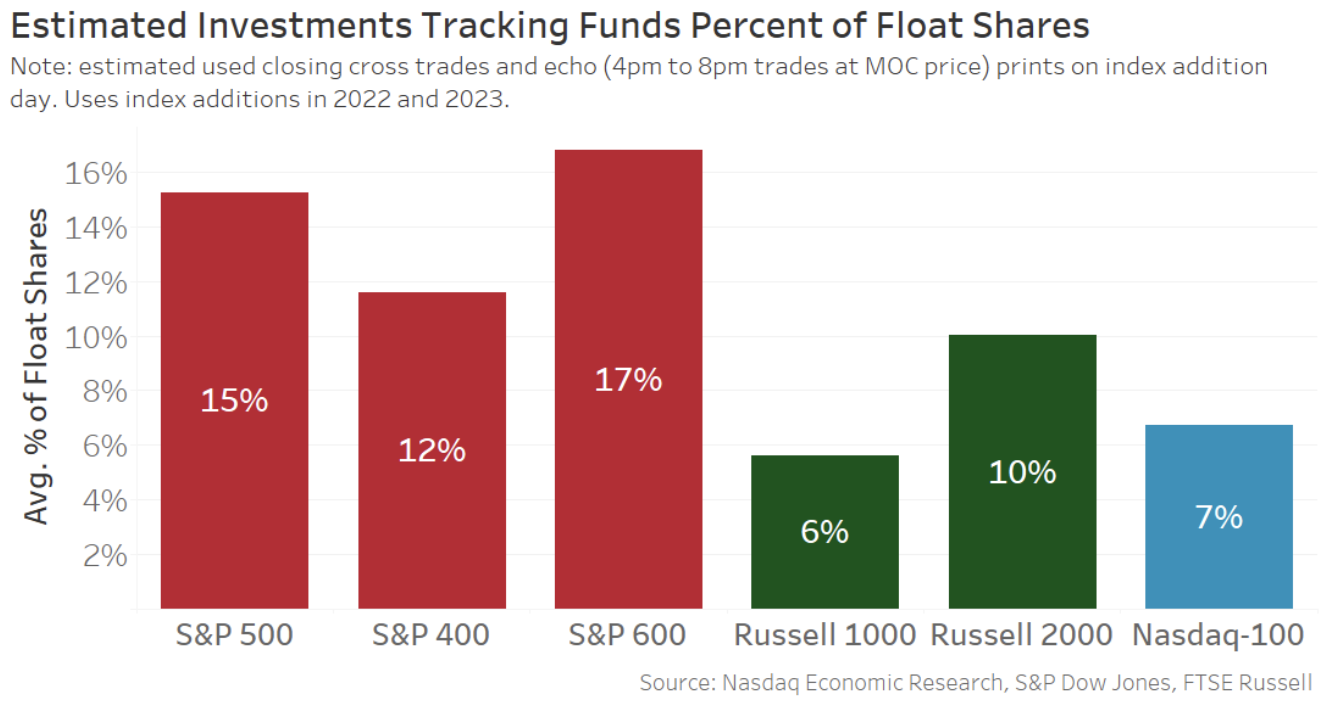
Today, we will use the bottoms-up approach to examine how many float-shares trade on rebalance days across major U.S. indexes. The findings (Chart 2) reveal that:
- Small caps have a significant proportion of index tracking, with 27% in the S&P 600 and Russell 2000.
- Although large-cap firms may qualify for all three major indexes, including the Nasdaq-100®, they could have up to 28% of their float shares acquired by index funds.
Although significantly more dollars are indexed to the S&P 500, up to $7.5 trillion, this measurement focuses on the proportion of each company’s float shares— a factor that remains consistent across all companies within each index.
Chart 2: Closing trades on index days show a potential 25% ownership of float shares by index funds
 trading indicates index tracking funds could own around 25% of float shares in many companies” width=”710″ height=”380″>
It’s crucial to remember that neither the top-down nor bottom-up approaches are flawless. Some futures and options hedges might mimic index funds, while actual index funds may pre-position to minimize market impact from known index trades. Additionally, some active funds may exhibit traits similar to “closet indexers.”
Incorporating Off-Exchange Trades into Closing Volumes
Off-exchange trading is becoming increasingly significant, particularly during closing trades.
Both exchanges and brokers can produce “echo prints” that replicate the official close price but record trades to the tape only after knowing the official close.
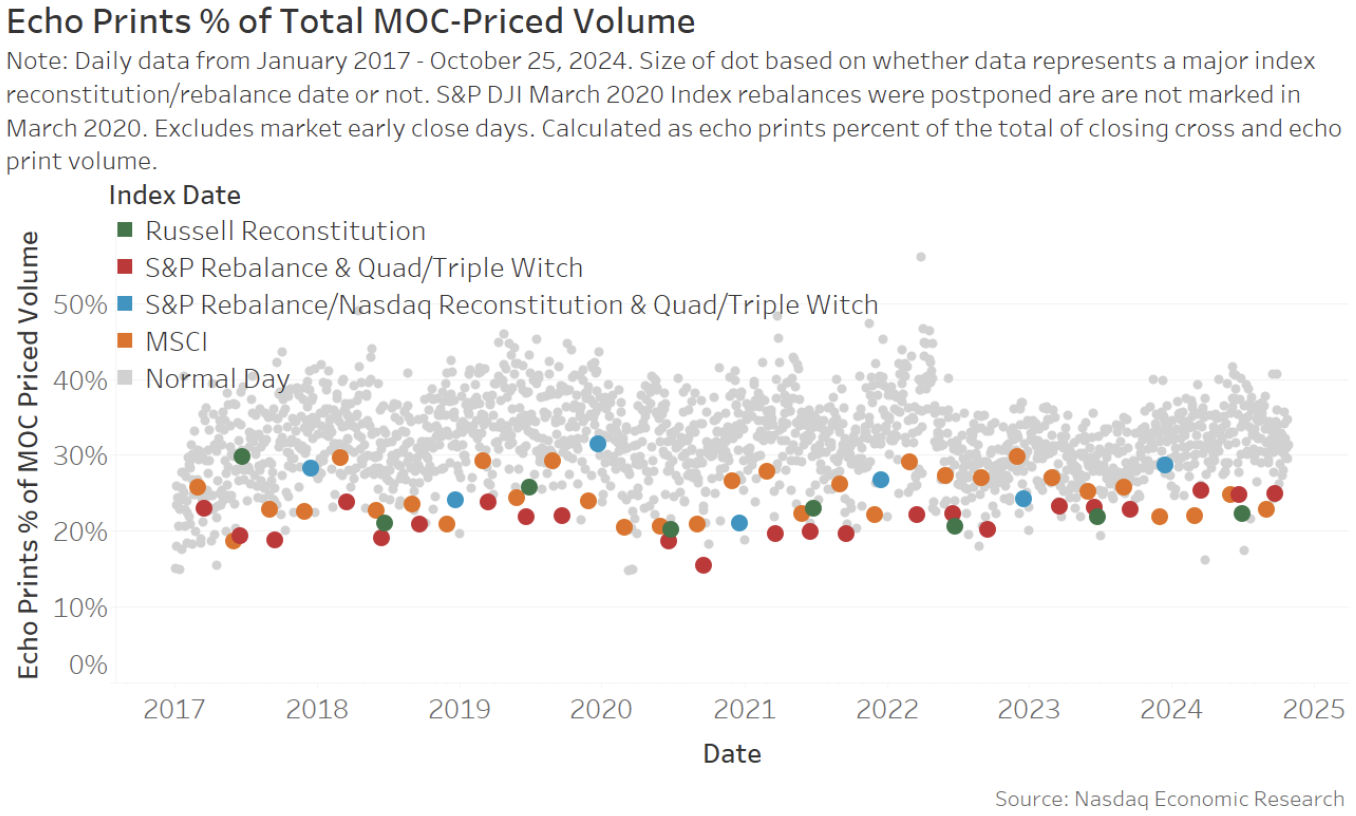
In this analysis, we include echo print trades that occur from 4 p.m. to 8 p.m. at the official close price into the “MOC volumes” referenced earlier. Interestingly:
- On a typical day, echo prints account for around 30% of the MOC volumes (grey dots in Chart 3).
- On an index rebalance day, the official close takes precedence, with echo prints making up around 20% of all trades.
Chart 3: Echo prints contribute a consistent share of total MOC-priced trades
“““html
trading
 trading ” width=”665″ height=”400″>
Understanding Index Addition: Impacts on Market Trading
Normal Market Close Trading vs. Index Rebalance Trading
Some might question whether we should exclude “normal”, or non-index, Market-on-Close (MOC) volume from our totals. This consideration arises from our prior observations that MOC activity is generally higher and less index-related than commonly assumed.
Upon examining the volume during a “normal” market close and comparing it to trading activity on index addition dates, it becomes clear that adjusting these figures would amount to merely a rounding error (as illustrated in Chart 4).
The data indicates that index trades appear disproportionately larger because Chart 1 represents the total market. In contrast, index trades predominantly involve the specific stocks being added to the index, thus amplifying their impact.
This discrepancy underscores the significance of index additions for the companies involved. They lead to substantial purchases by index funds, which tend to be long-term investors.
Chart 4: “Normal” MOC Activity Compared to Index Trading on Rebalance Days
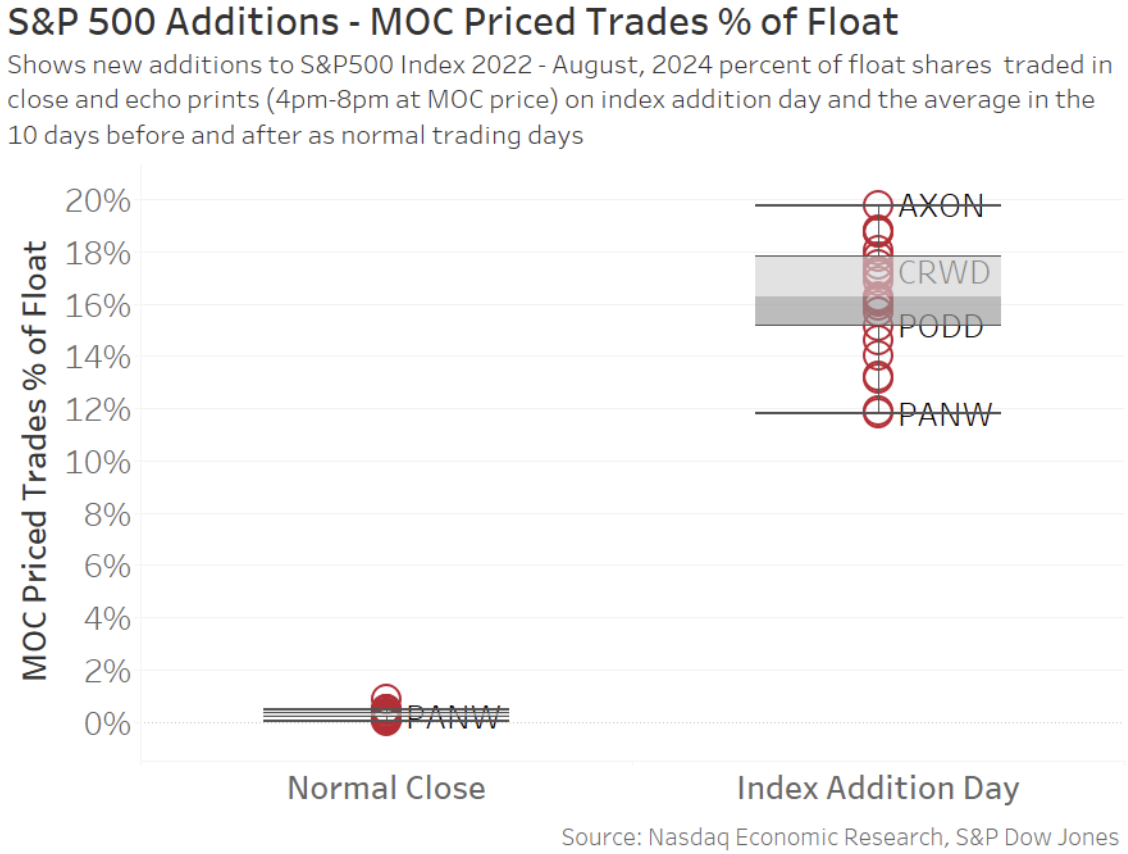 trading on a rebalance day” width=”528″ height=”400″>
According to Chart 4, there’s a typical variation in the results we report in Chart 2. While an average S&P 500 addition leads to a 16% increase in a company’s float shares, the actual trades can vary from 14% to 18% and, in some instances, exceed 18% significantly.
It’s important to note that most S&P additions tend to occur away from Quad Witching dates. This timing is crucial as Quad Witch trading could otherwise skew S&P outcomes artificially.
The S&P’s quarterly rebalance also includes various adjustments, such as updates on float, style, and shares outstanding. As the S&P 500 is a fixed-index comprising 500 companies, additions typically occur when a company exits the index, often due to mergers and acquisitions (M&A). Recent quarterly rebalances have also seen some companies promoted and demoted for more accurate representation in market capitalization groupings.
The Positive Impact of Index Addition for Companies
It’s evident that index inclusion generates considerable liquidity for the stocks entered into the index.
This analysis illustrates the proportion of float shares that exchange hands- largely driven by index funds surpassing other investors, especially on addition dates.
Moreover, index inclusion is generally beneficial for the companies involved. These stocks gain a new investor base that is typically large and long-term. Additionally, being part of an index can attract attention from active mutual funds, potentially enhancing opportunities for U.S. capital access in the future.
Nicole Torskiy, Economic Research Senior Specialist, contributed to this article.
“`


