Warren Buffett’s Selling Streak: What It Means for Investors
Few investors capture attention on Wall Street like Berkshire Hathaway‘s (NYSE: BRK.A)(NYSE: BRK.B) billionaire CEO, Warren Buffett. He has built an impressive track record, achieving a 5,728,235% cumulative return on his company’s Class A shares (BRK.A) since he took over in 1965. In comparison, the benchmark S&P 500 (SNPINDEX: ^GSPC) has returned 39,447%, dividends included, over the same period.
Berkshire’s success is notable not just for numbers; Buffett consistently shares valuable insights about investing and what he seeks in potential investments, especially during Berkshire’s annual meetings and in his yearly letters to shareholders.
Start Your Mornings Smarter! Get Breakfast news in your inbox each market day. Sign Up For Free »

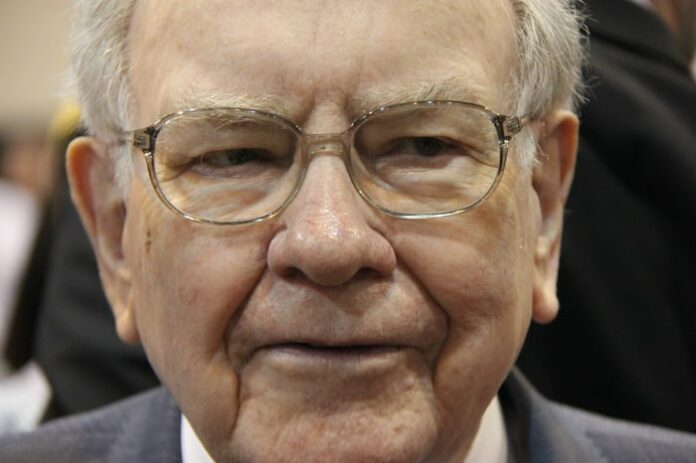
Berkshire Hathaway CEO Warren Buffett. Image source: The Motley Fool.
Buffett is known for his optimistic outlook and often warns against betting against America. However, his recent actions may suggest a more cautious approach. The upcoming Form 13F filing from Berkshire Hathaway, due after the market closes on Friday, Feb. 14, is expected to show that Buffett has been a net seller of stocks for nine consecutive quarters.
A $166 Billion Signal: Buffett’s Stock-Selling Streak
Fund managers with over $100 million in assets must file a 13F report with the Securities and Exchange Commission (SEC) within 45 days of the end of each quarter. This report reveals which stocks top managers are buying and selling.
The 13F filing for trading activity in the December-ended quarter is due on Feb. 14. Berkshire always submits its filing after the market closes on this deadline.
According to Berkshire’s 13Fs and quarterly cash flow statements, Buffett and his advisors, Todd Combs and Ted Weschler, have sold more stock (by market value) than they have bought for the past eight quarters, totaling $166.2 billion. This has increased Berkshire Hathaway’s cash reserves to a record high of $325.2 billion.
Although details are limited, Form 4 filings with the SEC hint that this trend continued in the fourth quarter. Berkshire invested a combined $795.8 million in stocks like Sirius XM Holdings, Occidental Petroleum, and VeriSign, while $1.275 billion in Bank of America (NYSE: BAC) stock was sold. After Oct. 15, when Berkshire’s stake in BofA fell below 10%, it was no longer required to report its sales.
Berkshire’s divestments also include significant sales of its top holding, Apple (NASDAQ: AAPL). Over the past year, more than 615 million shares of Apple have been sold, which is 67% of Berkshire’s previous holdings of over 915 million shares.

Image source: Getty Images.
Value Investing in a Challenging Market
Berkshire Hathaway’s strategy has always focused on long-term gains. Historically, Buffett has believed that recessions and bear markets are temporary, while economic growth tends to endure over time.
However, being a value investor means Buffett only buys stocks if their valuations are reasonable. Currently, many stocks are considered overvalued.
Take Apple, for instance. The company has struggled to grow sales from its physical products, though its subscription services have been more successful. This shift has led to two years of declining net income for Apple, at a time when its valuations seem high compared to past averages.
Similarly, Bank of America is no longer the attractive buy it once was. When Berkshire invested $5 billion in BofA in 2011, the stock was trading at a 62% discount to its book value. As of Feb. 7, BofA closed at a 34% premium to its book value.
The broader market presents a challenge, making it tough for Buffett to find good deals.

S&P 500 Shiller CAPE Ratio data by YCharts.
Though not a tool Buffett uses directly, the S&P 500’s Shiller price-to-earnings (P/E) ratio exemplifies current market conditions. This ratio looks at inflation-adjusted earnings over the previous decade to avoid distortion from short-term events.
As of Feb. 7, the S&P 500’s Shiller P/E was at 37.96, close to its peak of 38.89 during this bull market, and more than double its historical average of 17.21 over the past 154 years.
Historically, Shiller P/E levels above 30 have often preceded significant declines in the S&P 500, ranging from 20% to 89%.
The “Buffett Indicator,” which compares the market capitalization of U.S. stocks to the country’s GDP, also indicated excessive valuations. Historically averaging around 85%, it recently surpassed 207%.
With valuations at historic highs, the expectation remains that Buffett’s selling trend will continue for a ninth consecutive quarter.
Learn About Strong Investment Opportunities
Have you ever felt you missed investing in winning stocks? If so, consider this your second chance.
Rarely, our expert analysts identify “Double Down” stock recommendations for companies poised for growth. If you’re concerned about missing the boat, now could be your prime opportunity. Consider these impressive returns:
- Nvidia: If you invested $1,000 when we doubled down in 2009, you’d have $346,349!*
- Apple: If you invested $1,000 when we doubled down in 2008, you’d have $43,160!*
- Netflix: If you invested $1,000 when we doubled down in 2004, you’d have $554,176!*
Don’t miss the current “Double Down” alerts on three remarkable companies; another opportunity like this may not come around soon.
Learn more »
*Stock Advisor returns as of February 3, 2025
Bank of America is an advertising partner of Motley Fool Money. Sean Williams has positions in Bank of America and Sirius XM. The Motley Fool has positions in and recommends Apple, Bank of America, Berkshire Hathaway, and VeriSign. The Motley Fool recommends Occidental Petroleum. The Motley Fool has a disclosure policy.
The views and opinions expressed herein are the views and opinions of the author and do not necessarily reflect those of Nasdaq, Inc.

