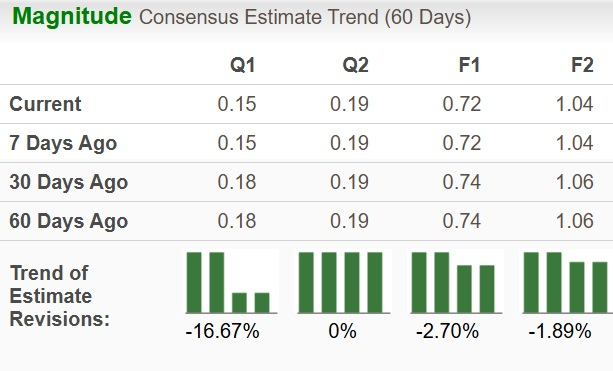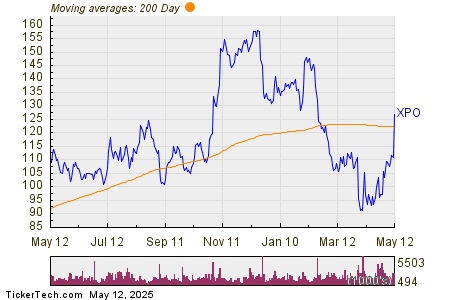
XPO Inc Shares Surge Past 200-Day Moving Average on Monday
In trading on Monday, shares of XPO Inc (Symbol: XPO) crossed above their 200-day moving average of $122.63, reaching a high of $128.00 per share. XPO Inc shares are up approximately 14.5% for the day. The chart below illustrates the one-year performance of XPO shares compared to its 200-day moving average:

Reviewing the chart, XPO’s lowest point in its 52-week range is $85.06 per share, while the 52-week high stands at $161, with the latest trade recorded at $127.10.
![]()
![]() Click here to find out which 9 other stocks recently crossed above their 200-day moving average »
Click here to find out which 9 other stocks recently crossed above their 200-day moving average »
Also See:
- Institutional Holders of NBSE
- SKT Price Target
- SQBG Market Cap History
The views and opinions expressed herein are the views and opinions of the author and do not necessarily reflect those of Nasdaq, Inc.