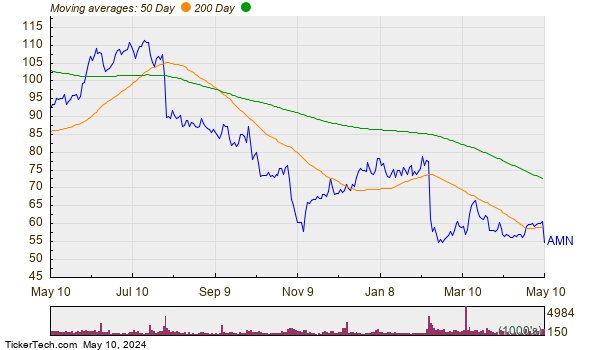
In trading on Friday, shares of AMN Healthcare Services Inc (Symbol: AMN) touched a new 52-week low of $53.00/share. That’s a $59.44 share price drop, or -52.86% decline from the 52-week high of $112.44 set back on 07/11/2023. Large percentage drops always require that the stock post even larger percentage gains from the low in order to recover the old price point, and for AMN that means the stock would have to gain 112.15% to get back to the 52-week high. For a move like that, AMN Healthcare Services Inc would need fundamental strength at the business level.
Here’s a rhetorical question: Who knows more about fundamentals at the business level than the company’s own insiders? So let’s take a look to see whether any company insiders were taking the other side of the trade as AMN shares were being sold down to this new 52-week low, focusing on the most recent trailing six month period. As summarized by the table below, AMN has seen 9 different instances of insiders buying over the past six months.
| Purchased | Insider | Title | Shares | Price/Share | Value |
|---|---|---|---|---|---|
| 02/27/2024 | Caroline Grace | Chief Executive Officer | 17,500 | $56.68 | $991,905.61 |
| 02/28/2024 | Jeffrey R. Knudson | CFO | 6,951 | $57.75 | $401,420.25 |
| 02/28/2024 | Whitney M. Laughlin | Chief Legal Officer | 863 | $57.74 | $49,829.62 |
| 02/28/2024 | Douglas D. Wheat | Director | 2,620 | $56.87 | $148,999.40 |
| 02/28/2024 | Sylvia Trent-adams | Director | 175 | $57.02 | $9,978.50 |
| 02/29/2024 | Mark G. Foletta | Director | 500 | $56.90 | $28,450.00 |
| 02/29/2024 | R. Jeffrey Harris | Director | 2,640 | $56.97 | $150,400.80 |
| 03/06/2024 | Jorge A. Caballero | Director | 2,000 | $56.80 | $113,600.00 |
| 03/04/2024 | Teri G. Fontenot | Director | 1,732 | $57.64 | $99,832.48 |
In the short run, while the new 52-week low suggests the stock is at the cheapest price and perhaps therefore the best bargain it has been over the last 52 weeks, the low print also means anyone who has purchased the stock over that timeframe is staring at an unrealized loss. Oftentimes, that factor drives a stock’s technical analysis metrics by creating overhead resistance, with investors who bought higher now anxious to reverse their trade once they are back to breakeven. The chart below shows where AMN has traded over the past year, with the 50-day and 200-day moving averages included.

Time will tell whether the insider purchases foretell a future rebound for AMN shares, which are presently showing a last trade of $54.78/share, a 3.36% rebound off of the new 52-week low.
![]() Ten Bargains You Can Buy Cheaper Than The Insiders Did »
Ten Bargains You Can Buy Cheaper Than The Insiders Did »
Also see:
Top Ten Hedge Funds Holding GRT
WB Videos
ETFs Holding NX
The views and opinions expressed herein are the views and opinions of the author and do not necessarily reflect those of Nasdaq, Inc.

