Jazz Pharmaceuticals Surpasses Key Trading Average Amid Positive Movement
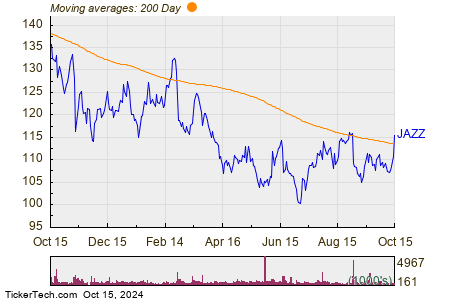
Shares of Jazz Pharmaceuticals plc (Symbol: JAZZ) have seen a solid uptick in trading, crossing above their 200-day moving average of $113.73, with values reaching as high as $116.63 per share on Tuesday. Currently, the stock is up approximately 4.1% for the day.
The performance chart below illustrates the one-year trend of JAZZ shares alongside their 200-day moving average:

Analyzing the chart, it’s noteworthy that JAZZ’s lowest point over the past 52 weeks was $99.06 per share, while the highest was $137.385. The latest trade recorded was $115.72, indicating a strong rebound this week.
![]() Explore which 9 other stocks have recently surpassed their 200-day moving averages »
Explore which 9 other stocks have recently surpassed their 200-day moving averages »
Related Topics:
Top Monthly Dividend Paying Stocks
HOL shares outstanding history
Funds Holding OIA
The views and opinions expressed herein are those of the author and may not reflect the views of Nasdaq, Inc.

