Gap Inc. Stock: Navigating Through Challenges with Promising Signs Ahead
Note: Gap’s FY’23 ended on February 3, 2024.
Gap Inc. (NYSE: GPS), the specialty retailer behind popular brands such as Gap, Old Navy, and Banana Republic, currently has its stock priced at around $21 per share. This marks a 6% increase year-to-date (YTD). In comparison, its competitor Guess (NYSE: GES) saw a 4% decline during the same period. Over the last two years, Gap has experienced difficulties with a revenue drop from $16.7 billion in 2021 to $14.9 billion in 2023, representing an 11% decrease. Nevertheless, strategic cost-cutting efforts from 2022-2023, along with new executive leadership including CEO Richard Dickson, are expected to boost sales and earnings moving forward. Positive momentum is starting to show with improved sales across its brands in FY 2024. Following the closure of 344 underperforming stores, we anticipate that Gap’s ongoing strategic changes will yield benefits for long-term sales growth.
Consumer Spending Remains Key to Apparel Industry
The apparel industry’s success greatly relies on consumer spending, which is influenced by consumer confidence levels. Though confidence has bounced back from the lows during the pandemic, it remains below pre-COVID figures. The U.S. consumer confidence index fell to 98.7 in September, down from 105.6 in August, showing a cautious outlook among consumers. For reference, confidence reached 132.6 in February 2020, just before the pandemic hit.
Gap’s Stock Volatility Compared to the Market
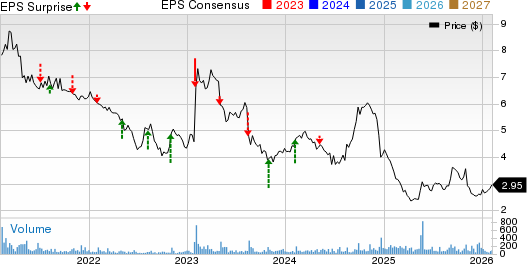
Over the past three years, Gap’s stock performance has been quite volatile compared to the S&P 500. Annual returns showed a decline of -11% in 2021 and -33% in 2022, followed by a dramatic increase of 97% in 2023. In contrast, the Trefis High Quality (HQ) Portfolio—which comprises 30 stocks—has consistently outperformed the S&P 500 each year, demonstrating a smoother return profile. The current uncertain economic climate raises questions about whether GPS might struggle again in the upcoming year or instead see a substantial rise.
Positive Trends in Recent Financials
In the first half of FY 2024, Gap’s revenue rose by 4% year-over-year (y-o-y) to reach $7.1 billion, and its profitability shows improvement, with earnings rising from 27 cents to 97 cents per share. Comparable store sales also grew by 3%, with Old Navy, accounting for a large portion of revenues, noting a 4% increase. The Gap brand saw a healthy 3% increase as well, while Banana Republic’s sales grew by 1%. Unfortunately, Athleta did not fare as well, with sales flat compared to last year’s decline of 10%. Given that Banana Republic and Athleta contribute under 20% of total revenue, the company remains heavily dependent on its flagship brands. Additionally, online sales climbed by 7% y-o-y, making up 33% of total sales during the second quarter.
Financial Health and Future Expectations
As of August 3, Gap reported a 59% increase in cash and cash equivalents, amounting to $2.1 billion. Free cash flow also improved, rising to $397 million from $324 million last year. Gross margins expanded by 360 basis points to 40.9%, reflecting effective management of promotional activities and inventory reserves (down 5% y-o-y in Q2 2024). This financial strengthening indicates positive trends in margins and cash flow, particularly for the Old Navy and Gap brands.
We forecast Gap’s revenues to reach $15 billion for fiscal year 2024, representing a modest increase. Expected earnings per share are projected to be $1.88. Consequently, our valuation for Gap has been adjusted to $22 per share, based on this EPS figure and an 11.7x P/E multiple for FY 2024, almost 7% more than the current market price. Hence, the stock is viewed as appropriately priced at this juncture, even as macroeconomic uncertainties may constrain consumer spending in the near future.
Anticipated Challenges for Gap’s Different Brands
Gap expects slight sales growth in FY 2024, aiming to surpass last year’s $14.9 billion revenue. The company anticipates operational income growth in the low to mid-teens and at least a 200 basis points increase in gross margin to approximately 40.8%. The prospects for Old Navy and Gap appear favorable, although Athleta faces challenges due to elevated discounting, and Banana Republic could take longer to recover. For Q3, slight sales increases are expected, with gross margins expanding by 50-75 basis points from 41.3% in Q3 FY’23, while operating expenses maintain at $1.3 billion.
To gauge Gap’s performance in comparison to its peers, review how other companies stack up on critical metrics. You can find additional valuable comparisons on our Peer Comparisons page.
Market Outlook: What Could Happen Next?
As investors hope for a soft landing for the U.S. economy, concerns loom regarding the potential impact of another recession. Our dashboard, “How Low Can Stocks Go During A Market Crash,” illustrates how key stocks have behaved through and after the last six market crashes.
| Returns | Oct 2024 MTD [1] |
2024 YTD [1] |
2017-24 Total [2] |
| GPS Return | -1% | 6% | 27% |
| S&P 500 Return | 2% | 23% | 162% |
| Trefis Reinforced Value Portfolio | 2% | 17% | 782% |
[1] Returns as of 10/16/2024
[2] Cumulative total returns since the end of 2016
Invest with Trefis Market-Beating Portfolios
See all Trefis Price Estimates
The views and opinions expressed herein are the views and opinions of the author and do not necessarily reflect those of Nasdaq, Inc.