Analyst Insights: Potential Upside for iShares ESG MSCI USA Leaders ETF
After analyzing the ETFs covered by ETF Channel, we evaluated their individual holdings’ trading prices against the average analyst’s 12-month target price. This led us to determine that the iShares ESG MSCI USA Leaders ETF (Symbol: SUSL) has an implied analyst target price of $113.02 per unit.
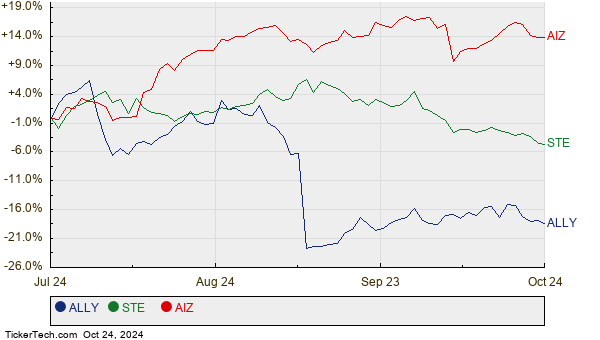
Currently priced at approximately $102.20 per unit, SUSL appears to have a potential upside of 10.59%. Notably, three of SUSL’s underlying holdings show significant upside compared to their target prices: Ally Financial Inc (Symbol: ALLY), STERIS plc (Symbol: STE), and Assurant Inc (Symbol: AIZ). ALLY is currently trading at $34.44 per share, while the average analyst target predicts a rise to $40.00 per share, marking a potential increase of 16.14%. Similarly, STE trades at $221.15 and is projected to reach $250.00, indicating a 13.05% upside. Analysts expect AIZ to rise from a recent price of $193.71 to a target of $218.80, representing a 12.95% increase. Below is a twelve-month price history chart comparing ALLY, STE, and AIZ:

Here’s a summary table of the current analyst target prices for the mentioned stocks:
| Name | Symbol | Recent Price | Avg. Analyst 12-Mo. Target | % Upside to Target |
|---|---|---|---|---|
| iShares ESG MSCI USA Leaders ETF | SUSL | $102.20 | $113.02 | 10.59% |
| Ally Financial Inc | ALLY | $34.44 | $40.00 | 16.14% |
| STERIS plc | STE | $221.15 | $250.00 | 13.05% |
| Assurant Inc | AIZ | $193.71 | $218.80 | 12.95% |
These targets raise important questions. Are analysts being realistic with their projections, or are they overly optimistic about future stock performance? Investors should consider whether these targets are based on current trends in the companies and the industry or if they reflect outdated assumptions. A significant target relative to the current price may suggest optimism but could also lead to revisions downward if reality falls short. Investors are encouraged to conduct thorough research.
![]()
![]() 10 ETFs With Most Upside To Analyst Targets »
10 ETFs With Most Upside To Analyst Targets »
Also see:
· Preferred Stocks By Industry
· KLXI market cap history
· XLC shares outstanding history
The views and opinions expressed herein are the views and opinions of the author and do not necessarily reflect those of Nasdaq, Inc.