Surge in Options Trading Among S&P 500 Giants
HCA Healthcare Inc Sees Strong Activity
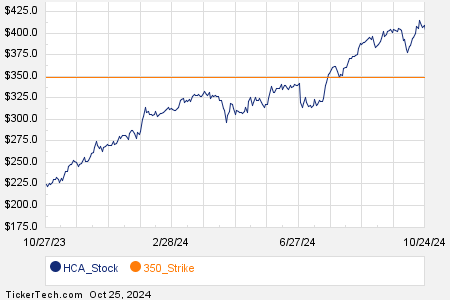
Looking at options trading among S&P 500 companies today, HCA Healthcare Inc (Symbol: HCA) has attracted notable interest, with a total of 6,663 contracts traded so far. This trading volume translates to about 666,300 underlying shares, as each contract represents 100 shares. Impressively, this amount is 56.7% of HCA’s average daily trading volume over the past month, which stands at 1.2 million shares.
The $350 strike put option, set to expire on November 15, 2024, has experienced particularly high volume today, with 548 contracts traded, representing roughly 54,800 underlying shares. Below is a chart illustrating HCA’s trading activity over the past year, with the $350 strike option marked in orange:

PepsiCo Inc’s Option Volume Climbing
PepsiCo Inc (Symbol: PEP) is also seeing significant options trading today, with a total of 27,788 contracts changing hands. This amounts to around 2.8 million underlying shares, representing a substantial 51.4% of PEP’s average daily trading volume for the past month, which is 5.4 million shares.
Particularly noteworthy is the $177.50 strike call option with a November 1, 2024 expiration. Today, 9,190 contracts have been traded, correlating to approximately 919,000 underlying shares. Below is a chart displaying PEP’s trading history over the last year, highlighted with the $177.50 strike:

FedEx Corp Draws Attention with Options Activity
FedEx Corp (Symbol: FDX) is witnessing heightened options trading, with a current volume of 7,005 contracts. This translates to approximately 700,500 underlying shares, covering 48.7% of FDX’s average daily trading volume of 1.4 million shares over the last month.
The $285 strike call option expiring on November 1, 2024, has particularly attracted attention, with 1,945 contracts traded today, equating to around 194,500 underlying shares. Below is a chart detailing FDX’s trading history over the past year, with the $285 strike featured prominently:

To explore the various available expirations for HCA, PEP, or FDX options, visit StockOptionsChannel.com.
![]()
![]() Today’s Most Active Call & Put Options of the S&P 500 »
Today’s Most Active Call & Put Options of the S&P 500 »
Also see:
The DividendRank Top 25
SQFT Historical Stock Prices
Top Ten Hedge Funds Holding MONT
The views and opinions expressed herein are the author’s and do not necessarily reflect those of Nasdaq, Inc.