Editor’s note: This story has been updated to clarify that Eli Lilly is set to report earnings premarket Wednesday.
Eli Lilly Poised for Earnings Report Amid Significant Stock Surge
Upcoming Earnings Expectations: Eli Lilly and Co LLY is set to announce its third-quarter earnings on Wednesday. Investors anticipate an earnings per share (EPS) of $1.45 and revenues of $12.1 billion in the premarket session.
The stock reflects a remarkable growth trajectory, surging 58.31% over the past year and showing a year-to-date gain of 51.23%. Currently trading close to $900 a share, the stock has seen a significant rise from around $250 just two years ago, despite recently falling from its record high of about $972. This upward momentum raises the possibility of a stock split, which could open doors for more investors to enter the market.
Eli Lilly’s strong performance is largely attributed to its influential position in the booming weight loss drug sector, with its products Mounjaro and Zepbound generating over $4 billion in revenue last quarter alone. As the weight loss market continues to expand, a stock split could further attract investors, enhancing Eli Lilly’s potential for future growth.
Now, let’s evaluate Eli Lilly’s current stock indicators and how they compare to Wall Street’s expectations.
Read Also: Eli Lilly’s Mirikizumab Shows Long-Term Sustained Efficacy, Safety For Ulcerative Colitis And Crohn’s Disease
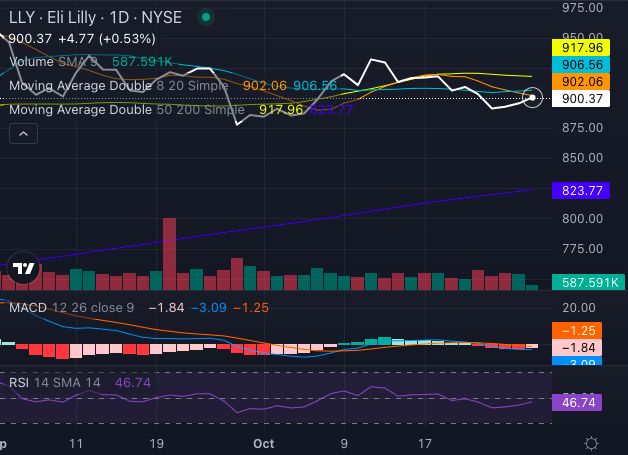
Current Stock Analysis: Eli Lilly’s technical indicators suggest a predominantly bearish outlook at this time.

Chart created using Benzinga Pro
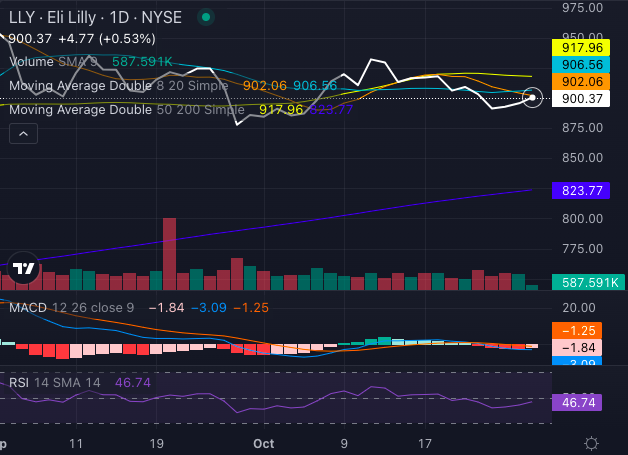
At $900.37, Eli Lilly’s stock sits below its five-, 20-, and 50-day exponential moving averages, indicating a persistent downward trend. The stock is also below its eight-day, 20-day, and 50-day simple moving averages of $902.06, $906.56, and $917.96, respectively. These conditions reinforce a bearish sentiment for the short to mid-term.
In contrast, the stock remains above its 200-day simple moving average (SMA) of $823.77, suggesting a bullish outlook over the long term. Notably, the MACD indicator at a negative 3.09 points aligns with a bearish perspective, whereas the RSI at 46.74 hints that the stock is nearing oversold levels, potentially signaling a forthcoming price reversal if buying interest increases.
While Eli Lilly’s technical indicators lean bearish at present, the positive long-term signals may pave the way for a potential recovery.
Analysts Predict Significant Growth for Eli Lilly
Ratings & Consensus Estimates: Analysts currently rate Eli Lilly stock as a Buy, with a price target of $927.42. Recent evaluations from Citigroup, Bernstein, and Truist Securities suggest a potential upside of 25.86%, with an average price target reaching $1,127.67.
Recent Price Activity: As of publication on Tuesday, Eli Lilly’s stock was trading relatively flat at $902.04.
Read Next:
Photo: Shutterstock
Market News and Data brought to you by Benzinga APIs

