Understanding Cannabis company leverage goes beyond the conventional Debt/EBITDA metric. Viridian proposes another valuation measure, Total Liabilities / Market Cap, offering a clearer reflection of asset value minus liabilities, impervious to accounting manipulations.
Shifting Perspectives
While some investors prefer accounting-based ratios, Viridian recognizes the importance of incorporating various measures. The model now includes a new metric based on critical principles:
Leases, constituting a significant part of many cannabis companies’ capital, should be viewed as debt due to their fixed and essential nature. For instance, Planet 13, 4Front, Green Thumb, Ascend, and Curaleaf have substantial lease liabilities forming a large percentage of their combined debt. Defaulting on leases, while not leading to bankruptcy, exposes companies to significant risks.
In a unique twist, certain cannabis companies are effectively borrowing from the government by failing to settle their taxes promptly. Viridian deems tax liabilities exceeding a quarter of tax expense as debt, regardless of their current or long-term classification.
Calculating Adjusted Net Debt
Adjusted net debt accounts for leases and excess taxes, modifying the traditional debt calculation. To balance the inclusion of leases as debt, EBITDA is adjusted by adding lease expenses to calculate EBITDAR.
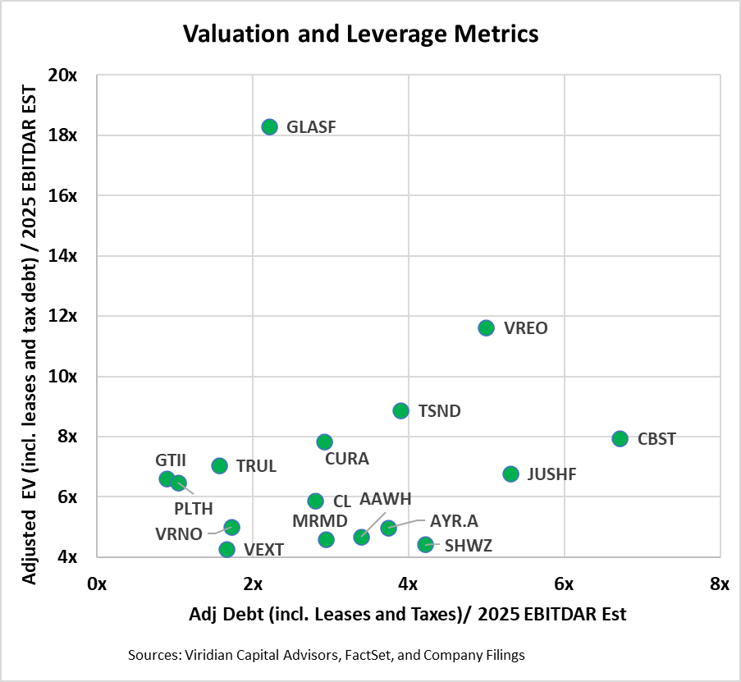
It’s crucial to adjust the standard EV/EBITDA valuation metric similarly to reflect the true financial picture. Viridian performs these adjustments to enhance the accuracy of valuation models.
Unveiling New Metrics
The implementation of adjusted measures unveils higher leverage and valuation metrics as depicted in the graph. These adjusted metrics offer a more realistic representation of financial health and company value which play a critical role in today’s market.
Data-driven Insights
Viridian’s Cannabis Deal Tracker remains a vital tool for investors and industry players to glean insights on capital allocation, mergers, and acquisitions. Since its inception in 2015, the tracker has analyzed over $50 billion in capital raises and M&A transactions, providing comprehensive data on industry trends and financial performance.
Stay informed on the latest market trends with insights from the Viridian Capital Chart of the Week, sourced from the comprehensive analysis of the Cannabis Deal Tracker.
The opinions expressed in this article are those of the author and do not necessarily reflect the views of Benzinga.
Market News and Data brought to you by Benzinga APIs