Looking at the recent activity among ETFs tracked by ETF Channel, the iShares Core MSCI EAFE ETF (Symbol: IEFA) has experienced a notable inflow of approximately $530.0 million. This represents a 0.4% week-over-week increase in outstanding units, rising from 1,626,200,000 to 1,633,200,000.
Today, among IEFA’s largest underlying holdings, Sea Ltd (Symbol: SE) is up about 3.3%. Conversely, shares of Teva Pharmaceutical Industries Ltd (Symbol: TEVA) are down approximately 0.6%, while AerCap Holdings NV (Symbol: AER) has increased by around 0.7%. For a full list of holdings, visit the IEFA Holdings page »
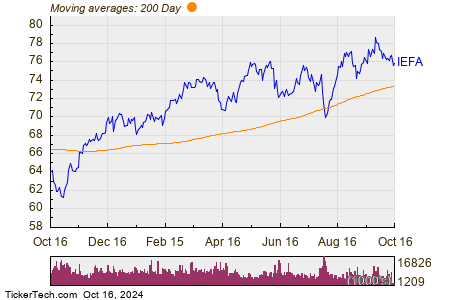
The chart below illustrates IEFA’s one-year price performance compared to its 200-day moving average:

The chart shows that IEFA’s share price has fluctuated between a low of $61.15 and a high of $78.825 over the past year, with the last recorded trade at $75.92. Assessing the current share price in relation to the 200-day moving average can provide useful technical insights — learn more about the 200-day moving average ».
Free Report: Top 8%+ Dividends (paid monthly)
Exchange-traded funds (ETFs) operate similarly to stocks, but instead of buying “shares,” investors purchase “units.” These “units” can be traded like stocks and can also be created or destroyed based on investor demand. Weekly, we monitor changes in shares outstanding to identify ETFs with significant inflows (new units created) or outflows (old units destroyed). The creation of new units typically necessitates the purchase of underlying holdings, while the destruction of units involves selling those holdings. Thus, large inflows or outflows can affect individual components within the ETFs.
![]() Click here to discover which 9 other ETFs have received notable inflows »
Click here to discover which 9 other ETFs have received notable inflows »
Also see:
Real Estate Dividend Stock List
Top Ten Hedge Funds Holding IIJI
NETC market cap history
The views and opinions expressed herein are the views and opinions of the author and do not necessarily reflect those of Nasdaq, Inc.

