Understanding the Current Market Sentiment with the RSI Indicator
Legendary investor Warren Buffett suggests a strategy of caution amidst market greed and opportunism during market fear. One tool that traders often use to assess market sentiment is the Relative Strength Index (RSI), which indicates momentum on a scale from zero to 100. An RSI reading below 30 typically signals that a stock is oversold.
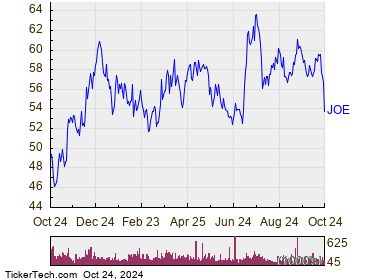
On Thursday, shares of St. Joe Co. (Symbol: JOE) fell into oversold territory, recording an RSI of 27.3 after trading as low as $52.51. In contrast, the S&P 500 ETF (SPY) reflects a healthier RSI of 62.2. This low RSI might prompt optimistic investors to view JOE’s current price as a potential buying opportunity, signaling that the recent significant selling may be running its course. Below is the one-year performance chart for JOE:

The chart indicates that JOE’s shares have traded within a 52-week range, with a low of $45.93 and a high of $64.69. The latest trade price sits at $53.36, suggesting room for a rebound.
Free Report: Top 8%+ Dividends (paid monthly)
![]() Discover 9 other oversold stocks worth monitoring »
Discover 9 other oversold stocks worth monitoring »
Also see:
- NLOP Videos
- CSCO DMA
- NOVT Average Annual Return
The views and opinions expressed herein are those of the author and do not necessarily reflect the opinions of Nasdaq, Inc.

