AXIS Capital Holdings Limited AXS posted first-quarter 2024 operating income of $2.57 per share, beating the Zacks Consensus Estimate by 1.2%. The bottom line increased 10.3% year over year.
The insurer’s results reflected higher premiums earned, lower catastrophe losses, improved income from the fixed maturities portfolio and a rise in underwriting income.
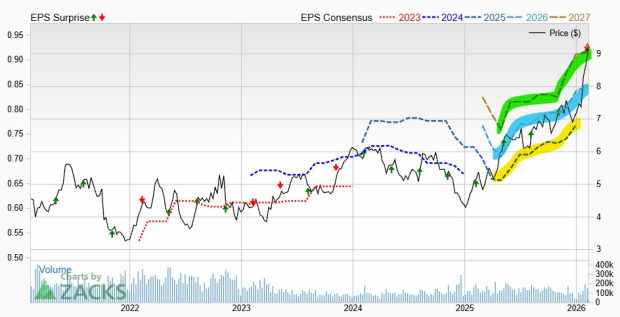
Axis Capital Holdings Limited Price, Consensus and EPS Surprise

Axis Capital Holdings Limited price-consensus-eps-surprise-chart | Axis Capital Holdings Limited Quote
Quarterly Operational Update
Total operating revenues of $1.4 billion missed the Zacks Consensus Estimate by 2.8%. The top line, however, rose 5% year over year on higher net premiums earned, net investment income and other insurance related income.
Net investment income jumped 25% year over year to $167 million, primarily attributable to a rise in income from the fixed maturities portfolio due to increased yields. Our estimate was $164.8 million.
Total expenses in the quarter under review rose 0.7% year over year to $1.15 billion, attributable to higher net losses and loss expenses, acquisition costs, interest expense and financing costs and reorganization expenses. Our estimate was $1.1 billion.
Pre-tax catastrophe and weather-related losses, and net of reinsurance were $20 million. This compares favorably with the year-ago loss of $38 million.
AXIS Capital’s underwriting income of $145.6 million increased 4.5% year over year. Our estimate was $141.5 million. The combined ratio deteriorated 20 basis points (bps) to 91.1.
Segment Results
Insurance: Gross premiums written improved 11.2% year over year to $1.5 billion, primarily attributable to increases in all lines of business with the exception of cyber lines that decreased in the quarter, primarily due to premium adjustments and a reduction in premiums associated with program business. Our estimate was $1.6 billion.
Net premiums earned increased 12.4% year over year to $917.9 million. Our estimate was $954.5 million.
Underwriting income of $122.9 million climbed 19% year over year. Our estimate was $231 million. The combined ratio improved 70 bps to 86.6.
Reinsurance: Gross premiums written rose 11.8% year over year to $1 billion. The improvement was due to an increase of $139 million attributable to all ongoing specialty lines of business mainly related to new business and the timing of renewals of significant contracts. It was partially offset by a decrease in run-off lines. Our estimate was $943.8 million.
Net premiums earned declined 17.8% year over year to $340 million. Our estimate was $352.1 million.
Underwriting income of $22.6 million decreased 37% year over year. Our estimate was pegged at a loss of $89.5 million. The combined ratio deteriorated 440 bps year over year to 95.8.
Financial Update
AXIS Capital exited the first quarter with cash and cash equivalents of $1.14 billion, up 20% from the end of 2023.
Debts were $1.3 billion at quarter-end, up 0.02% from the 2023-end level.
As of Mar 31, 2024, book value per share grew 5.7% from the end of 2023 to $57.13, driven by net income, partially offset by common share dividends declared and unrealized investment losses.
Annualized return on average common equity was 32.1% in the first quarter, which expanded 1,590 bps year over year.
Capital Deployment
As of Mar 31, 2024, AXIS Capital had $38 million of remaining authorization under the board-authorized share repurchase program for common share repurchases through Dec 31, 2024.
Zacks Rank
AXIS Capital currently carries a Zacks Rank #3 (Hold). You can see the complete list of today’s Zacks #1 Rank (Strong Buy) stocks here.
Performance of Some Other P&C Insurers
Chubb Limited CB reported first-quarter 2024 core operating income of $5.41 per share, which outpaced the Zacks Consensus Estimate by 2.3%. The bottom line jumped 22.7% year over year. Net premiums written improved 14.1% year over year to $12.2 billion in the quarter. Our estimate was $11.4 billion, while the Zacks Consensus Estimate was pegged at $13 billion.
Net investment income was $1.4 billion, up 25.7% year over year. The Zacks Consensus Estimate was pegged at $1.3 billion, while our estimate for the same was $1.4 billion. P&C underwriting income was $1.4 billion, up 16.7% year over year. Global P&C underwriting income, excluding Agriculture, was $1.3 billion, up 10.9%.
RLI Corp. RLI reported first-quarter 2024 operating earnings of $1.89 per share, beating the Zacks Consensus Estimate as well as the year-ago number by 16%. Operating revenues for the reported quarter were $394 million, up 17.6% year over year, driven by 17% higher net premiums earned and 21.3% higher net investment income. The top line, however, missed the Zacks Consensus Estimate by 0.1%.
Gross premiums written increased 13% year over year to $468 million. This uptick can be attributed to the solid performance of the Casualty (up 12.6%), Property (up 13.5%) and Surety segments (up 12.1%). Our estimate was $511 million. Underwriting income of $77.7 million climbed 16%. The combined ratio deteriorated 60 bps year over year to 78.5. The Zacks Consensus Estimate for the metric was pegged at 85, while our estimate was 77.7.
Cincinnati Financial Corporation CINF reported first-quarter 2024 operating income of $1.72 per share, which beat the Zacks Consensus Estimate by 1.7%. The bottom line surged 93.2% year over year. Total operating revenues in the quarter under review were $2.3 billion, which missed the Zacks Consensus Estimate by 1.4%. The top line, however, improved 8.8% year over year. Net written premiums rose 11% year over year to $2.2 billion.
Investment income, net of expenses, increased 17% year over year to $245 million, as bond interest grew 21% and dividends from the equity portfolio jumped 9%. The figure was higher than our estimate of $227.7 million. Total benefits and expenses of Cincinnati Financial rose 0.4% year over year to $1.9 billion. The figure was lower than our estimate of $2 billion. In its property & casualty insurance business, CINF recorded an underwriting income of $131 million against the year-ago loss of $10 million. The figure was higher than our estimate of $60.7 million underwriting income.
7 Best Stocks for the Next 30 Days
Just released: Experts distill 7 elite stocks from the current list of 220 Zacks Rank #1 Strong Buys. They deem these tickers “Most Likely for Early Price Pops.”
Since 1988, the full list has beaten the market more than 2X over with an average gain of +24.2% per year. So be sure to give these hand picked 7 your immediate attention.
RLI Corp. (RLI) : Free Stock Analysis Report
Chubb Limited (CB) : Free Stock Analysis Report
Cincinnati Financial Corporation (CINF) : Free Stock Analysis Report
Axis Capital Holdings Limited (AXS) : Free Stock Analysis Report
To read this article on Zacks.com click here.
The views and opinions expressed herein are the views and opinions of the author and do not necessarily reflect those of Nasdaq, Inc.