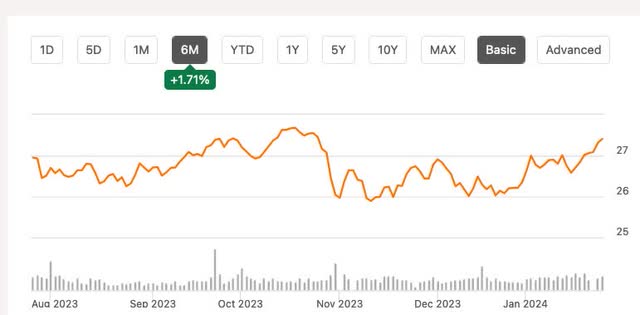
Enterprise Products Partners (NYSE:EPD) made a bold move last fall by deciding to leverage debt to seize opportunities for accelerated earnings growth. Unsurprisingly, Mr. Market reacted with a grimace, triggering a 10% slump in the stock price. While the price has since rebounded, the ascent mirrors the appreciation in some other midstream stocks.
Post the announcement, discontent among Enterprise shareholders surfaced in comments on various articles, reflecting a sense of injury caused by the company’s pivot. Conversely, echoing my sentiment, Julian Lin also advocates for shareholders to be appreciative of this strategic shift.
The following article delves into the historical context and the ripple effects on earnings growth triggered by this pivotal decision, aiming to complement Julian’s perspective.
Enterprise Products Partners in Brief
Enterprise enthralls with its captivating investor presentations, offering a treasure trove of insightful big-picture data. Each investor should diligently absorb and ponder over the invaluable information provided, which extends well beyond the realm of midstream energy. A majority of energy commentaries either overlook or counteract essential constituents of the global landscape; Enterprise’s presentations rectify this shortfall.
These presentations also furnish a plethora of intricate details about their operations, which are beyond the scope of this article to summarize.
However, here are some salient bullet points encapsulating crucial elements:
- Enterprise is a fully integrated midstream energy company.
- They garner fees by transporting Natural Gas Liquids (NGLs), Crude Oil, Natural Gas, Petrochemicals, and Refined Products.
- They possess 20 deepwater docks and operate numerous processing plants converting NGLs into essential raw materials for producing multiple plastics.
- Their average Return on Invested Capital (ROIC) in growth projects has been a stellar 12% over the past decade.
- They boast an A-level credit rating, unrivaled in the midstream space.
To gauge their global footprint, let’s analyze their cash flows. The payout ratio, defined as the ratio of all distributions to cash from operations adjusted to eliminate changes in working capital (denoted as ACfO below), has marginally decreased over the last decade:
The payout ratio exceeded 60%, occasionally touching 80% until 2018, and has remained below 60% since then.
Risks Associated with Investing in Enterprise
Perusing the investor presentation linked above and other associated sources illuminates that prophecies regarding global peak oil are merely delusions conceived by the technically inept. Arjun Murti also articulates compelling supplementary material on substack.
Nonetheless, the oil and gas sectors, like all commodities, adhere to cyclical patterns. Extended periods of subdued prices could prompt reduced volumes passing through Enterprise’s facilities for several years, a phenomenon witnessed previously.
Consequently, this could impede the growth of ACfO and potentially impact dividends. However, given the current industry landscape, I am skeptical about an imminent impact.
An improbable yet conceivable scenario is a dispute escalating among the Duncan family and their associates, who collectively own almost a third of Enterprise’s shares. This schism could prompt the conversion of Enterprise from an MLP to a C-Corp, inflicting substantial adverse consequences upon current shareholders.
Furthermore, in a flight of fancy, adverse political actions could transpire, detrimentally impacting the industry and disrupting volumes, at least temporarily. In due course, such consequences would prompt a reversal, in my assessment.
For numerous decades, the oil and gas saga has fixated on new leases and licenses. The halting of these rapidly instigates euphoria among politicians seeking public acclaim and can be just as swiftly reversed. History attests to this narrative.
Enterprise Cash Flows Unraveled
The overall cash flows reflect three phases in Enterprise’s business model:
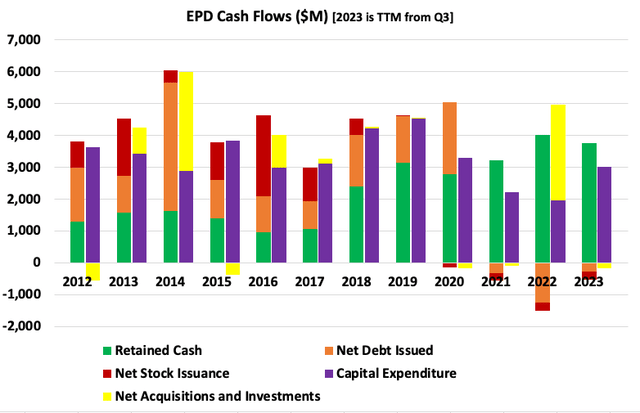
From 2012 to 2017, Enterprise embraced a growth model that involved substantial capital infusion. The retained cash (ACfO minus distributions), denoted by green bars, languished below half of their capital expenditure.
Growth was financed through the issuance of fresh stock (red bars) complemented by new debt (orange bars). The combined corpus was comparable to ACfO, which, in turn, matched capital expenditure plus acquisitions.
The business model metamorphosed post-2016, with the curtailment and eventual cessation of stock issuance, and culminating, a few years later, with the initiation of buybacks. Favorable markets steered an upsurge in retained cash. The new debt maintained a neutral leverage position.
This model was fairly robust, as we shall elucidate further. However, in 2021, Enterprise halted the accumulation of new debt, precipitating net debt reduction. Why did this change transpire?
Striving for Self-Preservation
I rely on Michael Boyd and his Investing Group for insights and analysis related to energy investments. Michael frequently interacts with Enterprise management, offering invaluable insights into their strategic blueprint multiple times each year.
Enterprise’s Financial Strategy and Impact on Growth
In the tumultuous times of the late teens and 2020, the fossil fuel industry faced fierce opposition. Critics labeled fossil fuels as evil and actively resisted their use, even in innovative solutions like carbon-negative oil production.
A Shift in Financial Strategy
Concerned about potential restrictions to debt markets, Enterprise contemplated safeguarding shareholders by moving to a 100% self-funding model. This bold decision led them to abstain from acquiring new debt from 2021 through 2023, successfully reducing their Debt/EBITDA ratio below 3.0x and garnering an upgraded credit rating.
Impact on Distributions and Growth
The ramifications of this strategic shift were reflected in the distribution plot, depicting a downturn in coverage ratio during challenging energy markets, followed by a surge after ceasing stock issuances despite a slowdown in dividend growth rate.
Levered Return on Equity
The analysis of earnings growth and levered Return on Equity showcased significant variations across the identified phases, primarily attributable to changes in the Debt Ratio.
Growth from Cash Retained and Raised
The examination of growth generated from retained or raised cash reinforced the impact of strategic financing decisions on the company’s financial landscape, further accentuated by the vivid graphic representation.
Overall Changes in ACfO
While the long-term implications of the growth contributed by the financial strategy change are paramount, the short-term impact is influenced by other factors like volume fluctuations and commodity prices.
Enterprise’s Financial Strategy Raises Concerns Among Shareholders
The dynamics of financial growth have been turbulent for Enterprise in the past decade. From 2012 to 2016, a challenging period for the oil and gas industry, ACfO exhibited a 1% CAGR, despite a 6% contribution from invested cash flows. However, subsequent to this, during the years of improving volumes from 2017 through 2020, the overall growth of ACfO/sh was at a CAGR of 10%, which was about twice the contribution from invested cash flows. Post-pandemic and the transition to full self-funding, from 2021 through 2023, the CAGR of ACfO stood at 6.4%, with a majority of the increase coming from invested cash flows. Nevertheless, in the long run, this model might only support a 3% growth of the distributions. Returning to sustaining leverage by taking on more debt seems likely to push that figure higher, which is a critical consideration for those seeking to hedge against inflation.
Seeking Enhanced Growth for Shareholders
Shareholders expressed optimism when Enterprise announced in the fall that they were amplifying growth capex and reverting to the debt markets. The expansion of their project list for 2024 and beyond from 10 to 15 “major” projects, at an incremental cost of $1.5B, marked a significant step, bringing them close to the levels of growth capex seen from 2017-2020.

Assuming that the $2.0B of new debt taken on so far in 2024 is the total for the year and pays off the ~$900M due first, approximately $1.1B will be available to support growth. Based on this assumption, the growth of ACfO is expected to be in the 7% range, surpassing the achievement from 2017 through 2020, reflecting the larger current ratio of retained cash to ACfO. Although this increase in debt will cause Debt/EBITDA to rise, the accelerated growth of ACfO is anticipated to bring it down swiftly.
It would be satisfying to witness Enterprise identifying further projects to maintain growth capex at a level of approximately $4B, given their extensive track record of high ROIC and exemplary project execution. Indeed, riding the coattails of such success seems promising. In the interim, the anticipation is for an improved cash earnings trajectory and higher shareholder returns in the next couple of years.
5 Stocks Our Experts Predict Could Double In the Next Year
By submitting your email, you'll also get a free pivot & flow membership. A free daily market overview. You can unsubscribe at any time.