Options order flow refers to the real-time data of options trades, which can provide valuable insights into the market sentiment and potential price movements. In this article, we will dive into the intricacies of options flow and explore how to spot buying opportunities, using the recent unusual options activity in Google ($GOOGL) as a case study.
What are options?
First, let’s define what options are. Options are financial contracts that give the buyer the right, but not the obligation, to buy or sell an underlying asset at a predetermined price and date. There are two types of options: calls and puts. A call option gives the buyer the right to buy the underlying asset, while a put option gives the buyer the right to sell the underlying asset.
Smart Money Buying

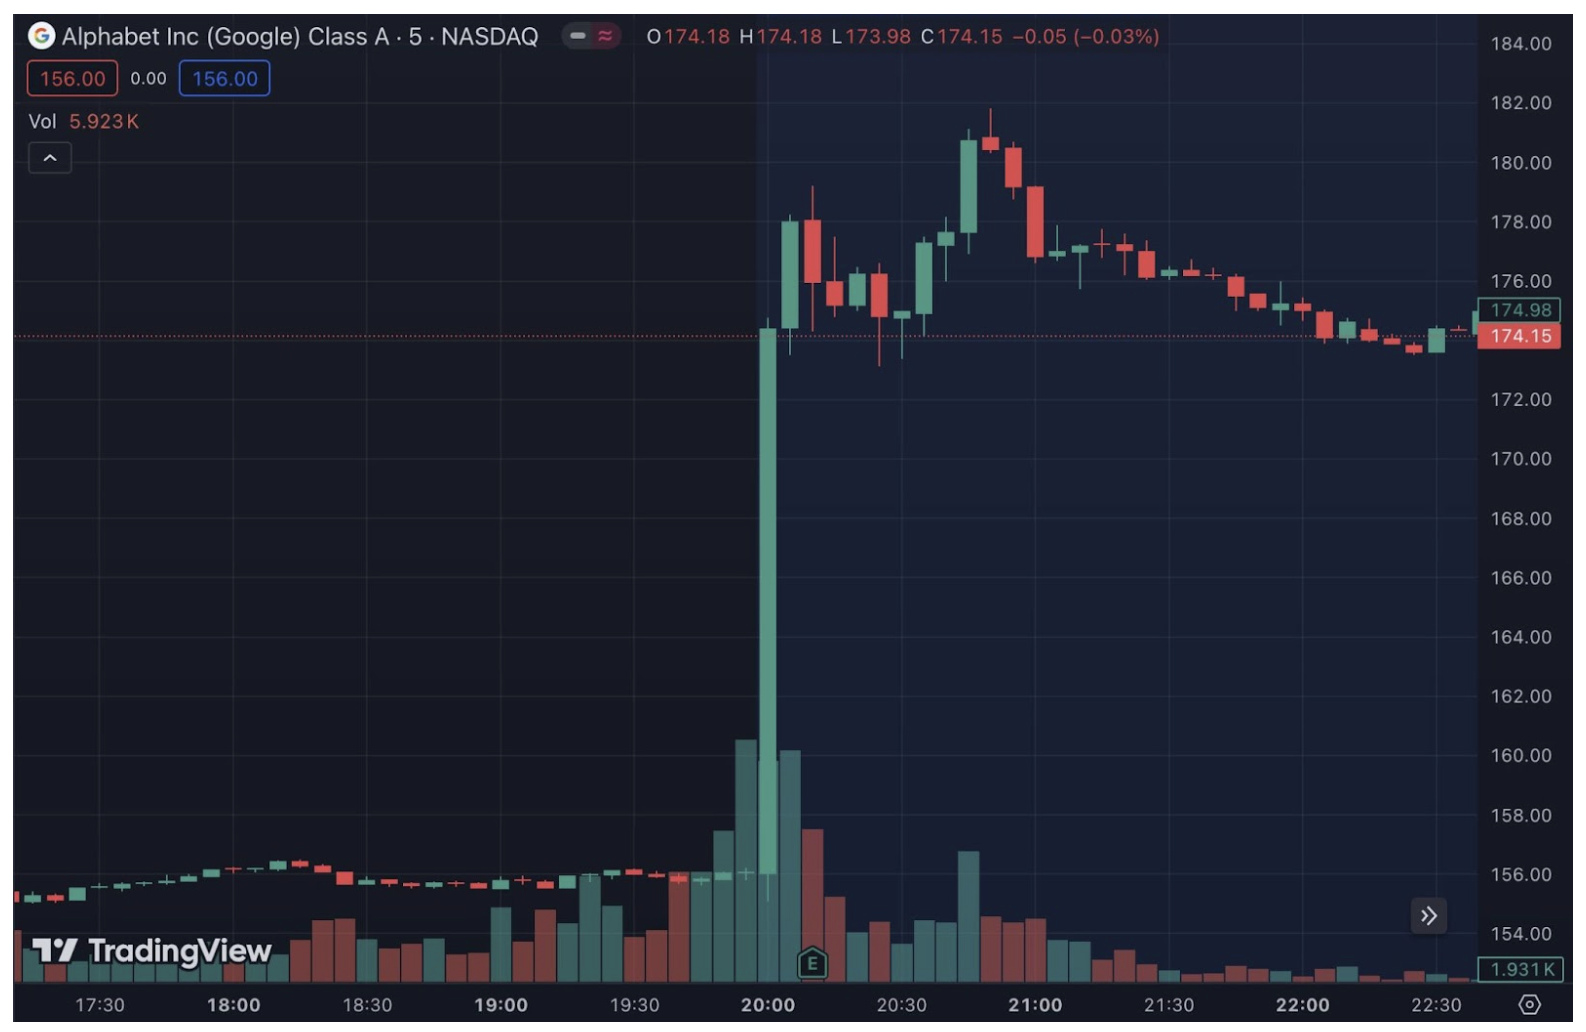
Now, let’s focus on the buying opportunity in Google’s options flow. After Google’s earnings report, the stock surged over 11% in after-hours trading. However, before the earnings release, there was unusual options activity, particularly in the January 16, 2026, $150 call contract. But how do we know that smart money was really buying these options?
Volume and Open Interest
The answer lies in the options contract volume and open interest data. Open interest (OI) represents the total number of outstanding contracts, while volume refers to the number of contracts traded during a specific period.

In the case of Google’s options flow, we noticed the following:
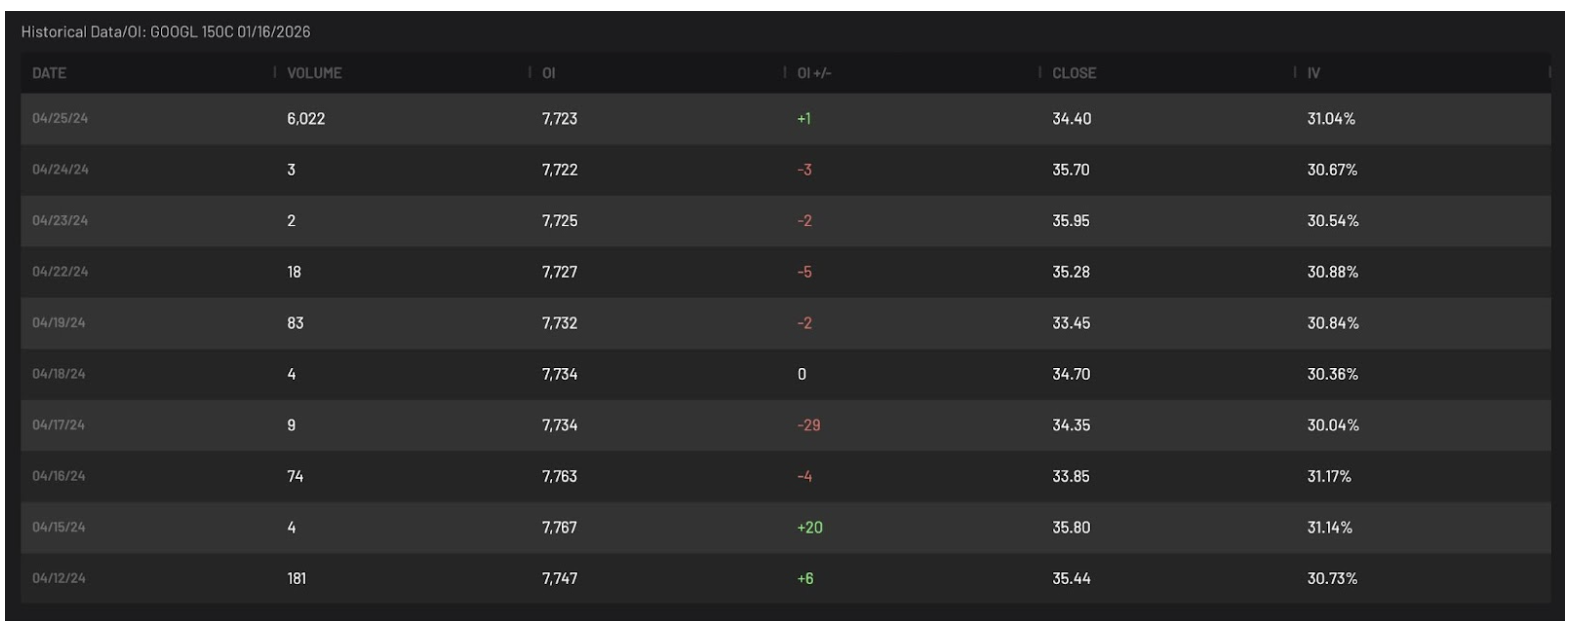
- The open interest remained consistent at around 7,000 contracts over the last week.
- The volume activity was non-existent until the day of the earnings report, with a huge spike of over 6,000 contracts.
- The volume increased when the price of the option dropped.
- The volume never exceeded the open interest, indicating that most of the trading activity was opening new positions.
These observations suggest that smart money was buying the $150 call options, as the volume increased significantly without a corresponding increase in open interest.

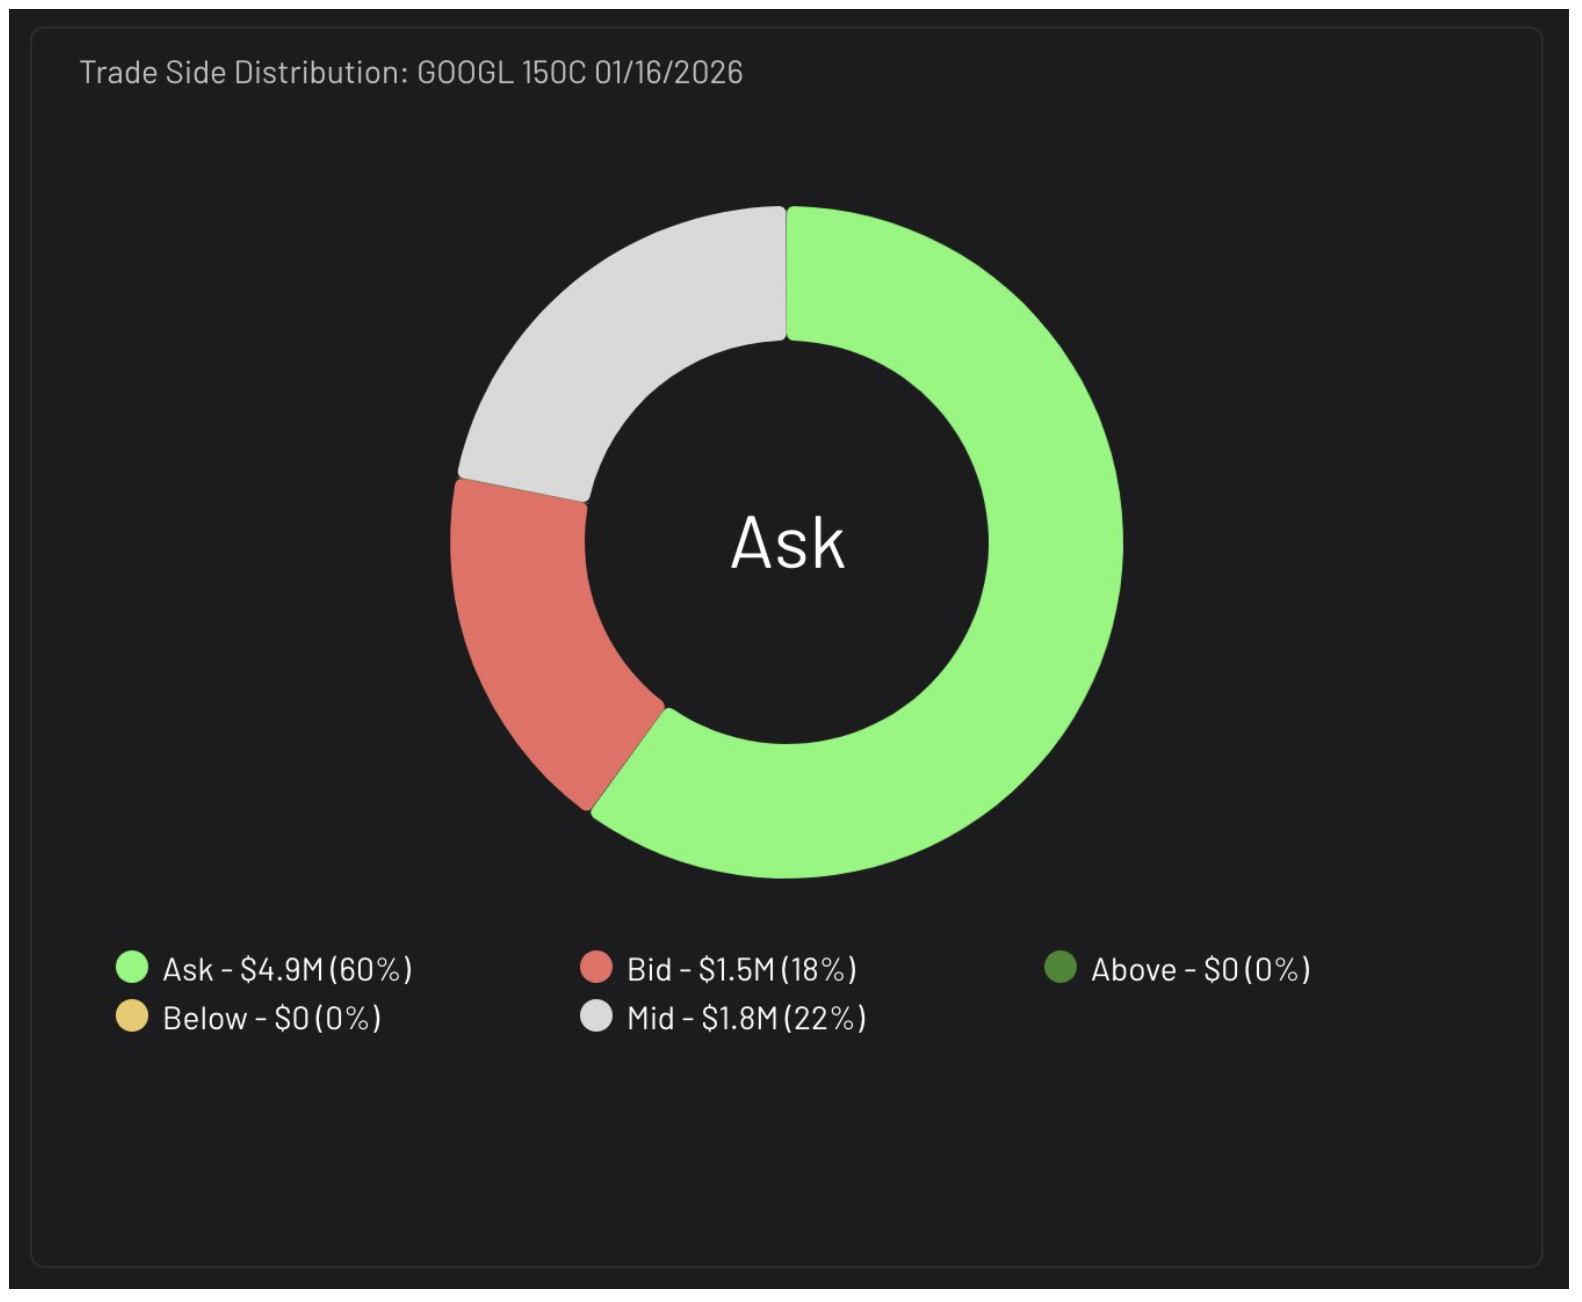
Furthermore, the trade side distribution data showed that over 60% of the trades were on the ask side, while only 22% were hitting mid-market and 18% on the bid. This distribution further supports the notion that the majority of the trading activity was buying pressure.
Contract Price and Implied Volatility

Other data points, such as the price and implied volatility of the contract, can also help identify buying opportunities. When spotting potential buying activity, look for:
- Implied volatility remaining in a neutral range compared to the volume entering the contract for the given day.
- The price of the contract staying in a generally small or neutral range, especially when compared to its historical data.
It’s important to note that sellers usually look to close out their positions when implied volatility is spiking, which is a topic for another discussion.
Conclusion
In summary, to identify buying opportunities in options flow, it’s crucial to analyze the trade side distribution data, the relationship between volume and open interest (both intraday and historically), and how the price and implied volatility have shifted. While no method is 100% accurate, these factors can help create a higher conviction that the trades were indeed buys.
Options flow analysis is just one piece of the puzzle when it comes to making informed trading decisions. By combining options flow insights with fundamental and technical analysis, traders can gain a more comprehensive understanding of the market and potentially identify profitable trading opportunities.
Cheddar Flow is a comprehensive options order flow and dark pool data platform that caters to individual investors and traders.
The platform is designed to make real-time data on unusual options activity in the US stock market accessible to users, helping them trade smarter and navigate the intricacies of the options markets.
Click here to learn more
The views and opinions expressed herein are the views and opinions of the author and do not necessarily reflect those of Nasdaq, Inc.

