Surge in Options Trading: Key Insights from Affirm, SoFi, and Peabody Energy
Options trading activity in the Russell 3000 index indicates a significant uptick for several companies today. Notably, Affirm Holdings Inc (Symbol: AFRM) is witnessing remarkable trading volume.
Affirm Holdings Sees Significant Volume
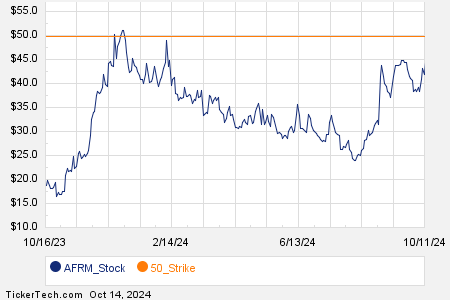
A total of 168,473 contracts for Affirm have changed hands today, equivalent to approximately 16.8 million underlying shares, as each contract corresponds to 100 shares. This figure represents a striking 178.2% of AFRM’s average daily trading volume over the past month, which stands at 9.5 million shares. The $50 strike call option expiring on October 18, 2024, has garnered particular interest, with 28,101 contracts trading, accounting for roughly 2.8 million underlying shares. Below is a chart illustrating AFRM’s trading history over the past twelve months, with the $50 strike highlighted in orange:

SoFi Technologies Experiences High Trading Volume
SoFi Technologies Inc (Symbol: SOFI) is also seeing elevated options trading activity, with 707,153 contracts traded today. This total reflects approximately 70.7 million underlying shares, which is 177.1% of SOFI’s average daily trading volume, recorded at 39.9 million shares. Notably, the $10 strike call option expiring on October 18, 2024, captures attention with 88,053 contracts traded, representing around 8.8 million underlying shares. The chart below showcases SOFI’s twelve-month trading performance, highlighting the $10 strike in orange:

Peabody Energy Corp Sees Notable Activity
Options trading for Peabody Energy Corp (Symbol: BTU) also reflects increased activity, with 52,859 contracts traded today. This translates into approximately 5.3 million underlying shares, amounting to an impressive 162.9% of BTU’s average daily trading volume of 3.2 million shares. The $27 strike call option expiring on October 18, 2024, has been particularly active, with 43,930 contracts trading, equal to about 4.4 million underlying shares. Below is a chart depicting BTU’s trading history over the past twelve months, featuring the $27 strike in orange:

For more information on available expirations for options on AFRM, SOFI, or BTU, visit StockOptionsChannel.com.
![]()
![]() Explore Today’s Most Active Call & Put Options of the S&P 500 »
Explore Today’s Most Active Call & Put Options of the S&P 500 »
Also see:
- YCS Options Chain
- BODY Split History
- Funds Holding DFSD
The views and opinions expressed herein are those of the author and do not necessarily reflect the views of Nasdaq, Inc.